
Java vs C#: Optimizing Docker for Kubernetes
Choosing the Right Optimization Levers, Memory Tunings, and Container Patterns for Modern Cloud Workloads

There's a question that keeps surfacing across engineering teams — sometimes in architecture reviews, sometimes buried in a Slack thread at 11 PM the night before a production incident — and it goes something like this: we're containerizing everything for Kubernetes, we're choosing between Java and C#, and we want to get this right.
Both ecosystems have matured enormously in the container space. Both have answers to the problems that plagued them five years ago. But those answers are different, the tradeoffs are real, and the wrong defaults will silently cost you — in cloud bills, in startup latency, and in operational headaches that only show up when things go wrong at scale.
This article doesn't take sides. What it does is go deep on what actually matters when you're building and deploying Java or C# services on Kubernetes: image sizes, startup behavior, JVM tuning, .NET Native AOT, garbage collection, memory limits, probe configuration, and the specific mistakes that bite teams over and over again.
The Modern State of Java and C# in 2026
Java
Java 25 is the current LTS as of late 2025. The language and runtime have come a long way — virtual threads (Project Loom) are stable and production-ready, the JVM's container awareness has been solid for years, and GraalVM Native Image has matured into a legitimate production option for teams willing to work within its constraints.
Spring Boot 3.x remains the dominant framework for backend Java, though Quarkus and Micronaut have carved out real niches precisely because they were designed with containers and fast startup times in mind from day one. For JDK distributions, Eclipse Temurin is the community standard, with Red Hat's OpenJDK and Azul Zulu as solid alternatives. All three have first-class Docker support.
What changed in recent Java versions that actually matters for containers:
UseContainerSupportis enabled by default, so the JVM reads cgroup memory and CPU limits correctly instead of sizing itself against the host machine — a problem that plagued early containerized JVM deployments.MaxRAMPercentagegives you a clean, portable way to configure heap without hardcoding megabyte values that break when you resize your pods.ZGC and Shenandoah are both production-grade, low-pause garbage collectors that behave well in memory-constrained environments.
AppCDS (Application Class Data Sharing) genuinely improves startup time for traditional JVM deployments without requiring a full recompilation model.
A note on the examples below: Dockerfiles in this article use the
21tag, which maps to a widely-available and stable Eclipse Temurin release. If you're starting fresh, substitute25once your toolchain — especially GraalVM — has matching image support. Always check Docker Hub for available tags before pinning a version in production.
.NET
.NET 10 is the current LTS as of November 2025. Microsoft has invested heavily in container-first deployment across several releases. Native AOT, still experimental in .NET 7, became a first-class feature in .NET 8 and has been progressively better supported in ASP.NET Core through .NET 9 and 10.
The chiseled Ubuntu images Microsoft maintains are stripped-down, non-root-by-default base images that produce significantly smaller final containers than the traditional aspnet base images. ReadyToRun compilation, trimming, and ahead-of-time compilation give .NET more optimization levers than it's ever had.
ASP.NET Core Minimal APIs pair particularly well with Native AOT, since they sidestep the reflection-heavy patterns that AOT struggles with. If you're building new services and targeting native compilation, Minimal APIs are the right starting point — not as a preference, but because the AOT compatibility story is genuinely better there.
Docker Fundamentals That Actually Matter Here
Before getting into language-specific details, a few fundamentals worth internalizing if you haven't already.
Image size affects pull time, storage cost, and attack surface. Smaller images pull faster during pod scheduling, cost less in registry storage, and give attackers fewer tools to work with after a container compromise.
Startup time matters enormously in Kubernetes because pods restart, scale out, and get rescheduled constantly. A 30-second JVM startup that seems acceptable in staging turns into a real problem when your autoscaler is trying to add capacity during a traffic spike.
Memory behavior determines whether you're crashing pods under pressure or over-provisioning and wasting money. CPU behavior determines whether you're hitting throttling under load.
Both Java and C# have specific characteristics in each of these dimensions that differ from Go or Rust containers, which is why generic Docker optimization advice often misses the mark for these runtimes. A JVM service and a statically compiled Go binary are fundamentally different runtime models, and your container strategy needs to reflect that.
Java Container Optimization
Multi-Stage Builds Are Non-Negotiable
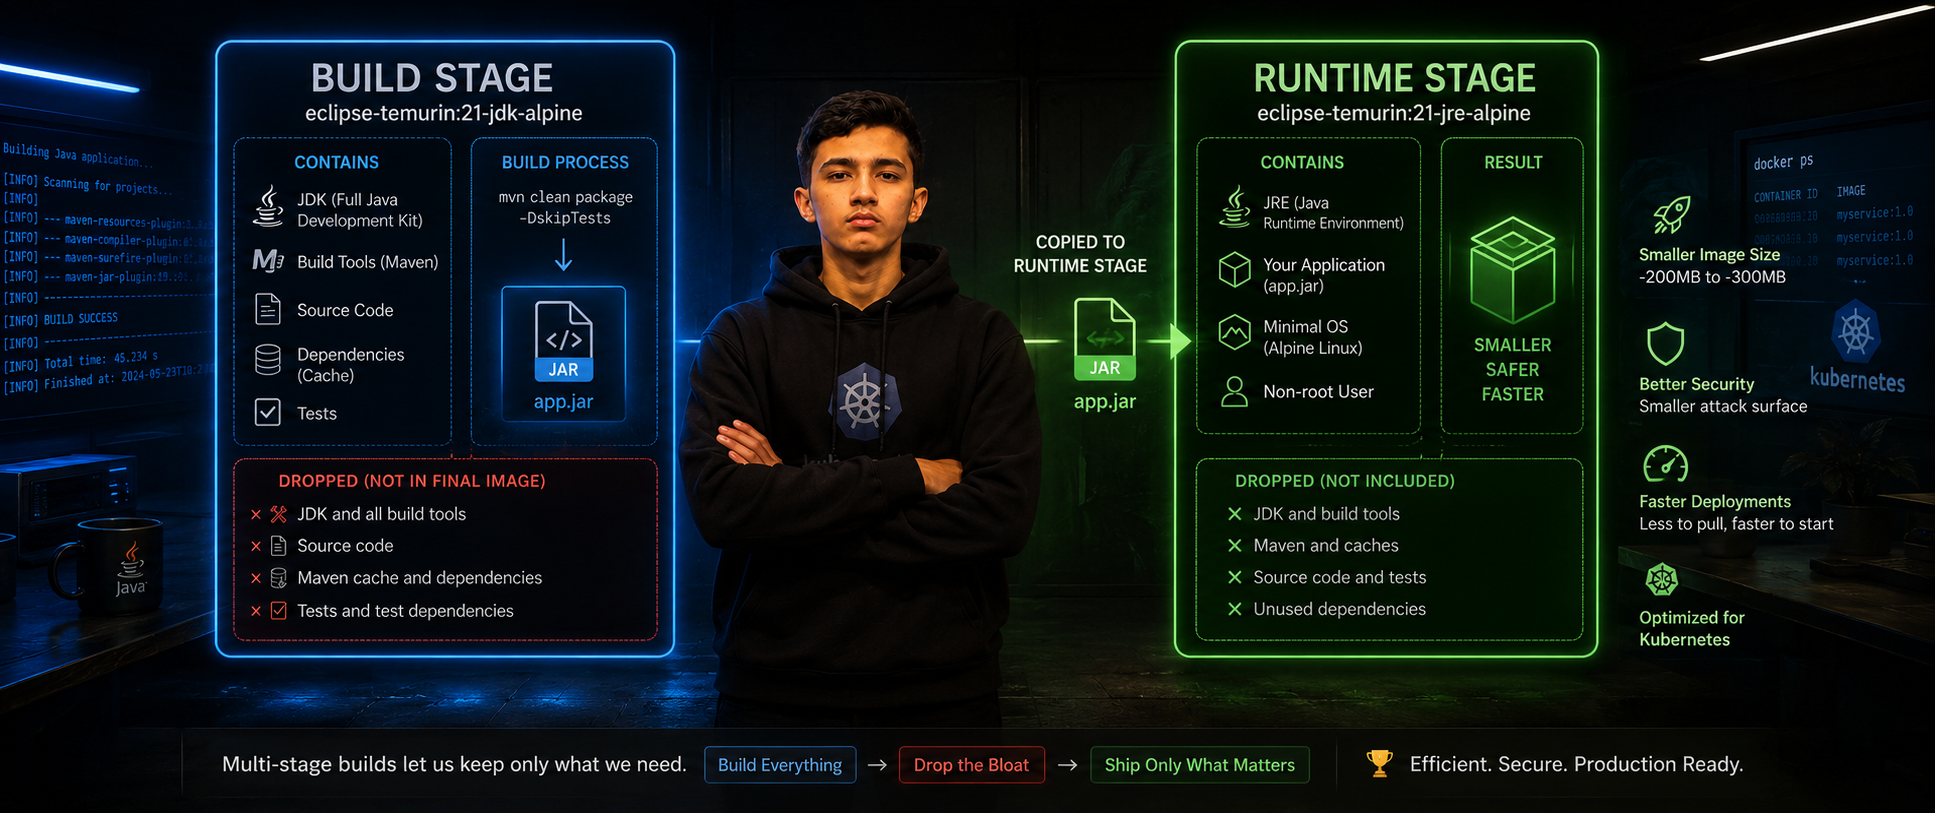
Shipping a full JDK in your production image is wasteful in almost every sense. A naive Java Dockerfile pulls in a 500+ MB JDK image along with your fat JAR, and the build toolchain has absolutely no business being in a production container.
Here's a reasonable starting point for a Spring Boot service:
# Stage 1: Build
FROM eclipse-temurin:21-jdk-alpine AS build
WORKDIR /app
COPY . .
RUN ./mvnw clean package -DskipTests

# Stage 2: Runtime only
FROM eclipse-temurin:21-jre-alpine
WORKDIR /app
COPY --from=build /app/target/*.jar app.jar

RUN addgroup -S appgroup && adduser -S appuser -G appgroup
USER appuser

ENTRYPOINT ["java", \
  "-XX:+UseContainerSupport", \
  "-XX:MaxRAMPercentage=75.0", \
  "-XX:+UseZGC", \
  "-jar", "app.jar"]
Switching from a JDK to a JRE-only base image cuts roughly 200–300 MB from the final image. Alpine-based images shave off more, but they use musl libc instead of glibc — which occasionally surfaces compatibility issues with native libraries compiled against glibc. Worth testing before committing to Alpine in production, especially if you use dependencies with native components like certain database drivers or crypto libraries.
Distroless Containers
Google's Distroless images take this a step further. They contain only the Java runtime and your application — no shell, no package manager, no OS utilities that an attacker could misuse after a container compromise.
# Stage 1: Build
FROM eclipse-temurin:21-jdk AS build
WORKDIR /app
COPY . .
RUN ./mvnw clean package -DskipTests

# Stage 2: Distroless runtime
FROM gcr.io/distroless/java21-debian12
WORKDIR /app
COPY --from=build /app/target/*.jar app.jar

ENTRYPOINT ["java", \
  "-XX:+UseContainerSupport", \
  "-XX:MaxRAMPercentage=75.0", \
  "-XX:+UseZGC", \
  "-jar", "app.jar"]
Debugging distroless containers is harder — no shell means no kubectl exec for ad-hoc inspection. You'll need kubectl debug with an ephemeral sidecar, or rely entirely on your observability stack. That's a fair tradeoff for production security, but make sure your team understands and accepts that operational model before adopting it.
GraalVM Native Image
This is the most significant shift available to Java teams, and it's worth understanding properly rather than just copy-pasting the Dockerfile.
GraalVM Native Image compiles your application ahead-of-time into a standalone native binary — no JVM, no warmup. Startup times drop from seconds to milliseconds. Memory footprint drops dramatically because you're no longer carrying a JIT compiler, metaspace, or a full runtime in memory.
Spring Boot 3.x has first-class support for Native Image through native Maven and Gradle plugins:
# Stage 1: Native compile
FROM ghcr.io/graalvm/native-image:21 AS build
WORKDIR /app
COPY . .
RUN ./mvnw -Pnative native:compile -DskipTests

# Stage 2: C runtime only — this is a native binary, not a JAR
FROM gcr.io/distroless/cc-debian12
WORKDIR /app
COPY --from=build /app/target/myservice .

ENTRYPOINT ["/app/myservice"]
Notice the runtime base image is distroless/cc-debian12 — not a Java base. Since the output is a native binary, you only need glibc and the C runtime, not a JVM. This keeps the final image genuinely small and free of Java metadata.
The build takes longer — 5–15 minutes for a complex service is normal — and there are real constraints around reflection, dynamic class loading, and runtime proxies that require explicit configuration hints in reflect-config.json and resource-config.json. For frameworks that lean heavily on reflection, writing those hints is a genuine time investment, not an afternoon task.
The reward is a service that starts in 50–100ms, uses a fraction of the heap, and deploys as a compact binary. For event-driven microservices, serverless-style patterns, or anything that scales to zero, Native Image is the right choice. For long-running, compute-intensive services where JIT's aggressive runtime optimization pays off at peak throughput, the traditional JVM still has the edge.
JVM Tuning for Containers
A handful of flags that matter specifically in Kubernetes environments:
-XX:+UseContainerSupport — Enabled by default since JDK 10. Reads cgroup limits correctly. Never disable it.
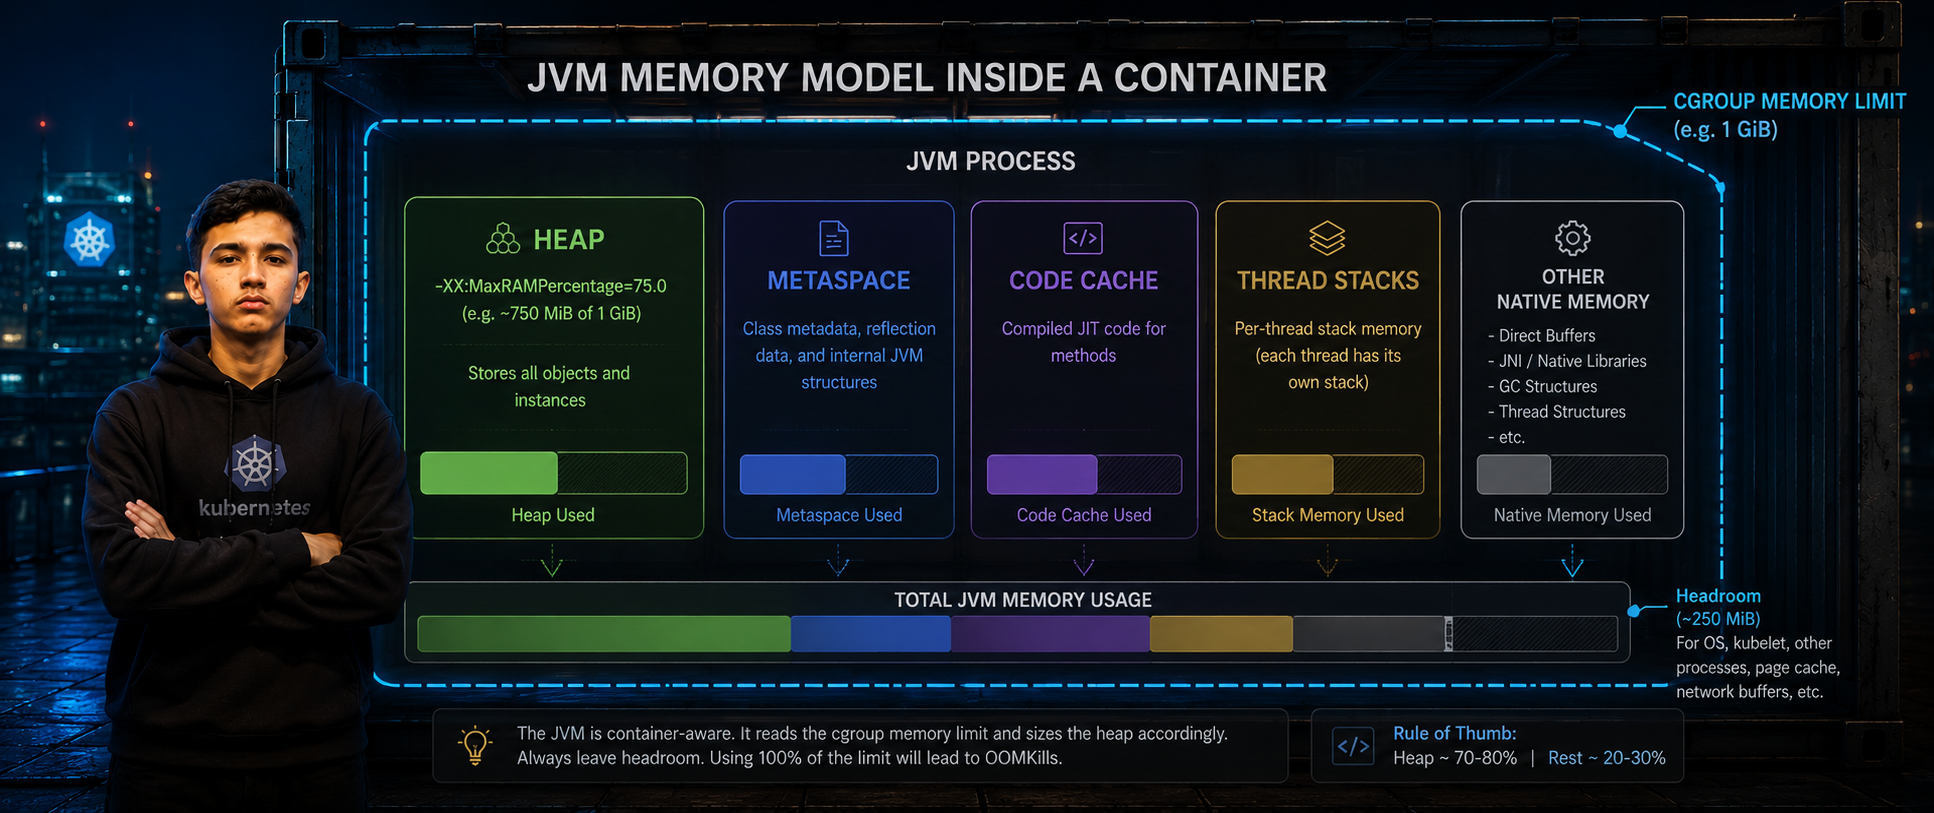
-XX:MaxRAMPercentage=75.0 — Sets heap to 75% of available container memory. The remaining 25% covers metaspace, code cache, thread stacks, and native allocations. Setting this to 100% will trigger OOMKills even though the heap "fits" — there's always non-heap consumption to account for.
-XX:+UseZGC — Delivers consistent low-pause garbage collection, well-suited for latency-sensitive services. G1GC is the default and solid for most workloads, but ZGC's pause times are more predictable under memory pressure. Shenandoah is a reasonable alternative with similar design goals.
-XX:+TieredCompilation -XX:TieredStopAtLevel=1 — Can improve startup time at the cost of peak throughput. Useful if you're not on Native Image but need faster pod readiness for frequent scaling events.
For services that restart frequently or scale aggressively, AppCDS is worth the setup effort. It serializes class metadata to a shared archive that gets memory-mapped on startup, reducing JVM initialization time by several seconds for large applications:
# Step 1: Generate the class list
java -XX:DumpLoadedClassList=app.classlist -jar app.jar

# Step 2: Create the shared archive
java -Xshare:dump \
  -XX:SharedClassListFile=app.classlist \
  -XX:SharedArchiveFile=app.jsa \
  -jar app.jar

# Step 3: Use the archive at runtime
java -Xshare:on \
  -XX:SharedArchiveFile=app.jsa \
  -XX:MaxRAMPercentage=75.0 \
  -XX:+UseZGC \
  -jar app.jar
C# / .NET Container Optimization
Multi-Stage Builds for .NET
Same principle, same payoff. The .NET SDK image runs around 800 MB to 1 GB. Your production container needs only the ASP.NET Core runtime.
# Stage 1: Build and publish
FROM mcr.microsoft.com/dotnet/sdk:10.0 AS build
WORKDIR /src
COPY . .
RUN dotnet restore && \
    dotnet publish -c Release -o /app/publish

# Stage 2: Chiseled runtime
FROM mcr.microsoft.com/dotnet/aspnet:10.0-noble-chiseled
WORKDIR /app
COPY --from=build /app/publish .
USER app

ENTRYPOINT ["dotnet", "MyApi.dll"]
The noble-chiseled tag refers to Microsoft's chiseled Ubuntu images — stripped-down base images with minimal attack surface, non-root by default, and significantly smaller than the standard aspnet images. Switching to chiseled is a one-line Dockerfile change that cuts the final image by 30–40% with zero code changes. If there's one thing to do before anything else on the .NET side, this is it.
.NET Native AOT
Native AOT in .NET compiles your application into a standalone native binary at publish time — the .NET equivalent of GraalVM Native Image, with similar tradeoffs in both directions.
# Stage 1: AOT publish
FROM mcr.microsoft.com/dotnet/sdk:10.0 AS build
WORKDIR /src
COPY . .
RUN dotnet publish -c Release -r linux-x64 \
    --self-contained true \
    -p:PublishAot=true \
    -o /app/publish

# Stage 2: C runtime only — no .NET runtime layer needed
FROM mcr.microsoft.com/dotnet/runtime-deps:10.0-noble-chiseled
WORKDIR /app
COPY --from=build /app/publish .
USER app

ENTRYPOINT ["/app/MyApi"]
With Native AOT, you're on runtime-deps rather than aspnet — just the native C runtime, no .NET runtime layer at all. The final image can get surprisingly small, sometimes under 60 MB for a well-trimmed Minimal API service.
Constraints to know before committing: reflection must be declared via [DynamicallyAccessedMembers] attributes or rd.xml files, serialization works well with System.Text.Json's source generation mode, and Entity Framework Core has limited Native AOT support depending on the database provider and version. Check your specific dependencies before going down this path for data-heavy services.
ReadyToRun and Trimming
If full Native AOT feels like too much overhead for a given service, ReadyToRun provides ahead-of-time compilation of IL to native code — faster startup without the full AOT constraints:
dotnet publish -c Release -r linux-x64 \
    --self-contained true \
    -p:PublishReadyToRun=true \
    -p:PublishTrimmed=true
Trimming removes unreachable IL code from the published output, meaningfully reducing image size. It does require careful testing — it can silently remove code paths that appear dead to the linker but are invoked via reflection at runtime. Run your full integration and end-to-end test suite after enabling it. Unit tests alone are unlikely to catch trimming-caused failures.
Memory Configuration for .NET Containers
.NET manages its heap differently from the JVM. Key environment variables for containerized .NET services:
DOTNET_GCHeapHardLimit— Sets a hard memory ceiling for the GC in bytes. Useful for strict per-pod memory isolation.DOTNET_GCConserveMemory— A value from 0 to 9 that trades GC aggressiveness for memory conservation. Values of 5–7 are useful under memory pressure; higher values reduce footprint at the cost of more frequent collections. Start at 0 and tune up only if you're seeing memory strain.DOTNET_SYSTEM_GC_SERVER— Defaults totruein containers since .NET 6. Server GC is appropriate for backend services on multi-core hosts and rarely needs to be overridden.
Kubernetes-Specific Considerations
Resource Requests and Limits
This is where Java teams most frequently get burned. Without resource requests and limits, the Kubernetes scheduler has no useful information, and your pods will get evicted under memory pressure without warning — often at the worst possible moment.
For a traditional JVM service:
resources:
  requests:
    memory: "512Mi"
    cpu: "500m"
  limits:
    memory: "1Gi"
    cpu: "2000m"
Set the memory limit conservatively above your expected heap plus overhead. Setting memory request equal to limit (Guaranteed QoS class) prevents OOM eviction under cluster memory pressure — worth doing for latency-critical services. For native compilation services, you can set much tighter limits — often 64–128 Mi memory, 100–250m CPU — and that's where the real resource efficiency gains show up at scale.
Startup Probes, Readiness, and Liveness
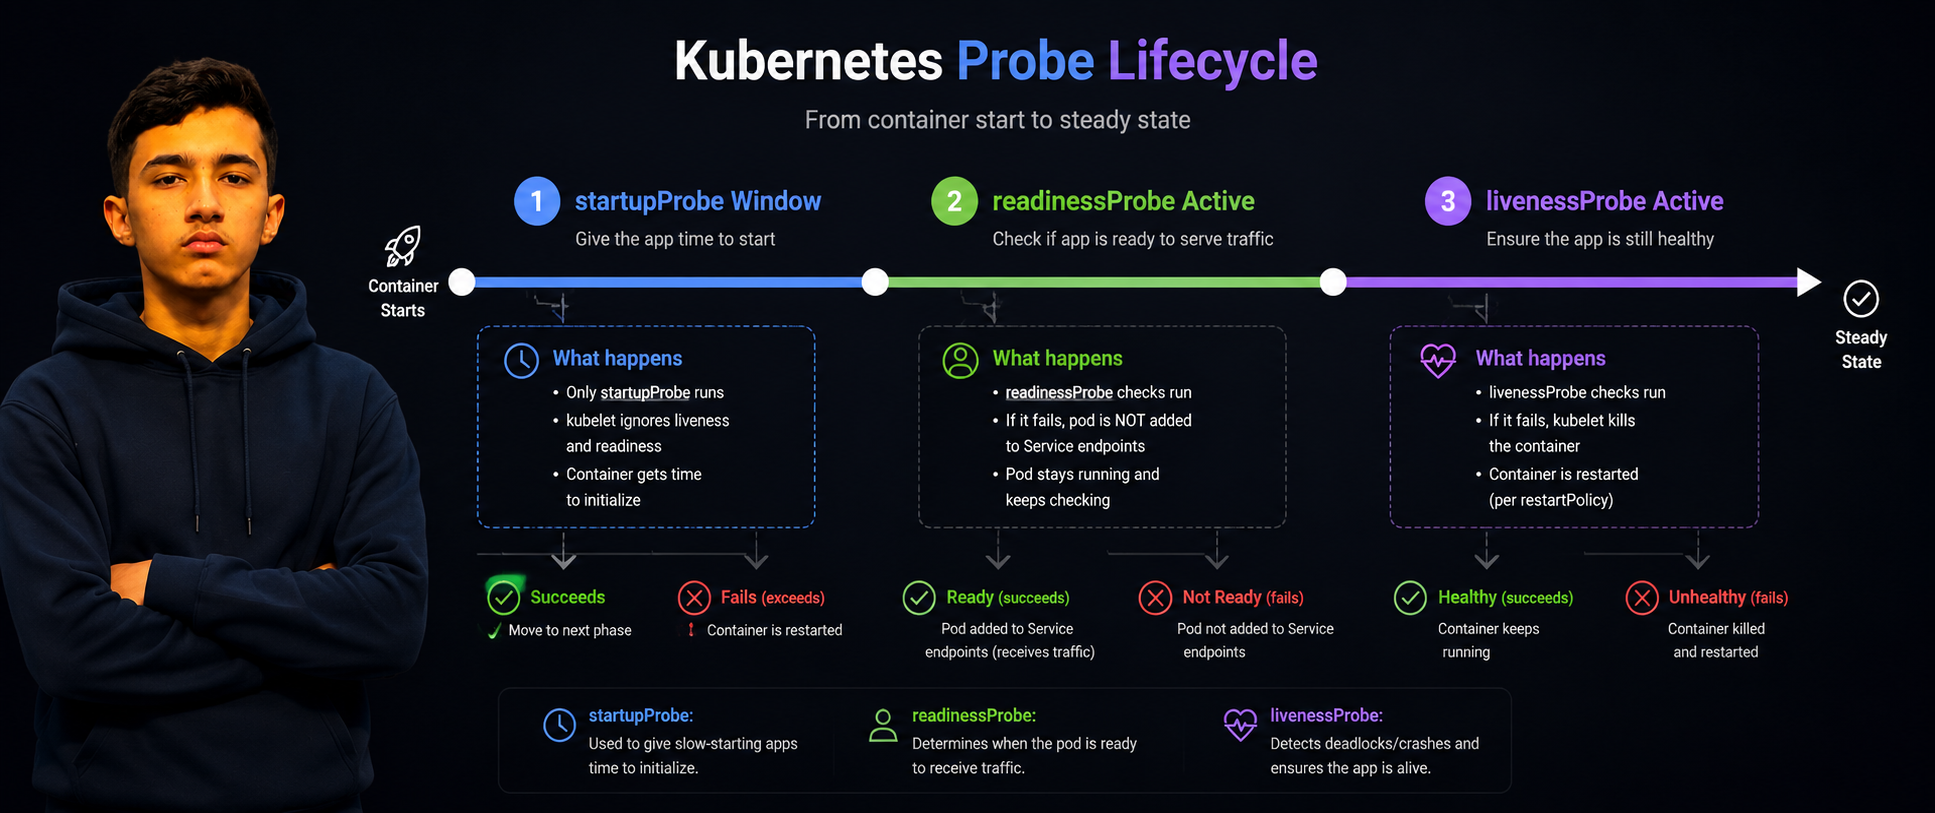
This trio is critical and commonly misconfigured, and getting it wrong causes cascading problems that are genuinely painful to debug.
The startup probe exists specifically for slow-starting applications. It gives the container time to initialize before the liveness probe kicks in and starts restarting it for appearing unhealthy:
startupProbe:
  httpGet:
    path: /actuator/health/readiness
    port: 8080
  failureThreshold: 30
  periodSeconds: 5

readinessProbe:
  httpGet:
    path: /actuator/health/readiness
    port: 8080
  initialDelaySeconds: 0
  periodSeconds: 5
  failureThreshold: 3

livenessProbe:
  httpGet:
    path: /actuator/health/liveness
    port: 8080
  periodSeconds: 15
  failureThreshold: 3
Spring Boot Actuator exposes /actuator/health/readiness and /actuator/health/liveness out of the box when you add management.health.probes.enabled=true to your application properties. ASP.NET Core has built-in health check endpoints via app.MapHealthChecks("/healthz").
Never route the liveness probe to an endpoint that checks downstream dependencies. If your database is slow, that should affect readiness — stop sending traffic to this pod — not liveness, which triggers a restart. Misconfiguring this is one of the most common causes of cascading pod restart storms during dependency degradation: slow database causes pod restarts, pod restarts add more connection pressure to the database, which makes it slower, which causes more restarts.
Autoscaling
CPU-based HPA is the baseline, but for JVM services it can be misleading during JIT warmup. JVM pods spike CPU on startup in ways that don't reflect steady-state load — your autoscaler sees those spikes, adds more pods, which also spike CPU on start, and suddenly you have more pods than you actually need.
For JVM services, memory-based or request-rate-based autoscaling gives more meaningful signals. KEDA (Kubernetes Event-driven Autoscaling) is worth evaluating for queue-depth or RPS-based scaling in production workloads:
apiVersion: autoscaling/v2
kind: HorizontalPodAutoscaler
metadata:
  name: java-service-hpa
spec:
  scaleTargetRef:
    apiVersion: apps/v1
    kind: Deployment
    name: java-service
  minReplicas: 2
  maxReplicas: 20
  metrics:
  - type: Resource
    resource:
      name: memory
      target:
        type: Utilization
        averageUtilization: 70
Here's a complete Kubernetes Deployment manifest for a Java service, putting all of the above together:
apiVersion: apps/v1
kind: Deployment
metadata:
  name: java-service
  labels:
    app: java-service
spec:
  replicas: 3
  selector:
    matchLabels:
      app: java-service
  template:
    metadata:
      labels:
        app: java-service
    spec:
      securityContext:
        runAsNonRoot: true
        runAsUser: 1000
        runAsGroup: 1000
        seccompProfile:
          type: RuntimeDefault
      containers:
      - name: java-service
        image: myregistry/java-service:1.0.0
        ports:
        - containerPort: 8080
        resources:
          requests:
            memory: "512Mi"
            cpu: "500m"
          limits:
            memory: "1Gi"
            cpu: "2000m"
        securityContext:
          allowPrivilegeEscalation: false
          capabilities:
            drop:
            - ALL
        env:
        - name: JAVA_TOOL_OPTIONS
          value: "-XX:MaxRAMPercentage=75.0 -XX:+UseZGC"
        startupProbe:
          httpGet:
            path: /actuator/health/readiness
            port: 8080
          failureThreshold: 30
          periodSeconds: 5
        readinessProbe:
          httpGet:
            path: /actuator/health/readiness
            port: 8080
          periodSeconds: 5
          failureThreshold: 3
        livenessProbe:
          httpGet:
            path: /actuator/health/liveness
            port: 8080
          periodSeconds: 15
          failureThreshold: 3
        lifecycle:
          preStop:
            exec:
              command: ["sh", "-c", "sleep 5"]
      terahJ91ZuNL8Y2px8iYciYeHN8sfSh5eXH8: 60
Java vs C# in Kubernetes: The Real Comparison
Startup Speed
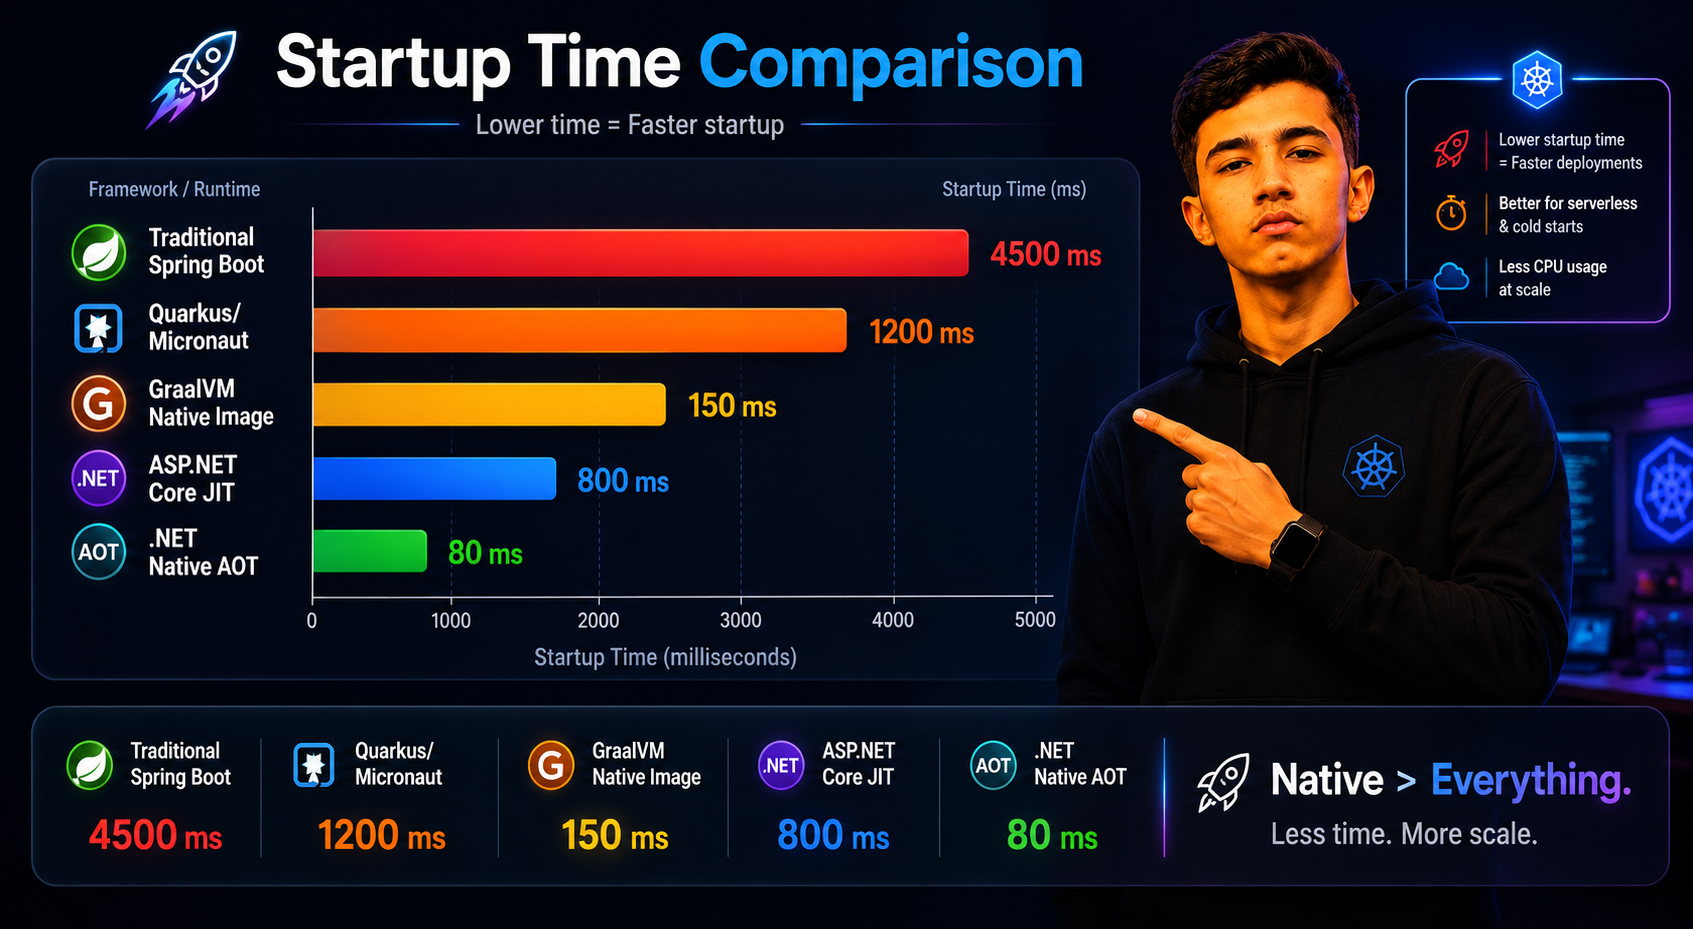
Traditional Spring Boot commonly hits 10–15 seconds on cold start. Quarkus and Micronaut are faster by design — often 1–4 seconds — because they push more work to build time rather than runtime. GraalVM Native Image brings this down to 50–200ms, competitive with native Go and Rust binaries.
On the .NET side, a typical ASP.NET Core service starts in 1–5 seconds on standard JIT. .NET Native AOT reaches 20–100ms — comparable to GraalVM Native Image.
For standard Kubernetes deployments running 3–5 replicas with gradual scaling, a 10-second JVM startup is usually acceptable. For scale-to-zero patterns, event-driven architectures with bursty traffic, or rapid horizontal scaling, startup time becomes a real bottleneck and native compilation moves from a nice-to-have to essential.
The more interesting comparison is between Quarkus and standard .NET JIT — they land in similar territory. If you're not using native compilation, .NET starts faster than traditional Spring Boot, but the gap largely disappears once you bring Quarkus or Micronaut into the equation.
Memory Footprint
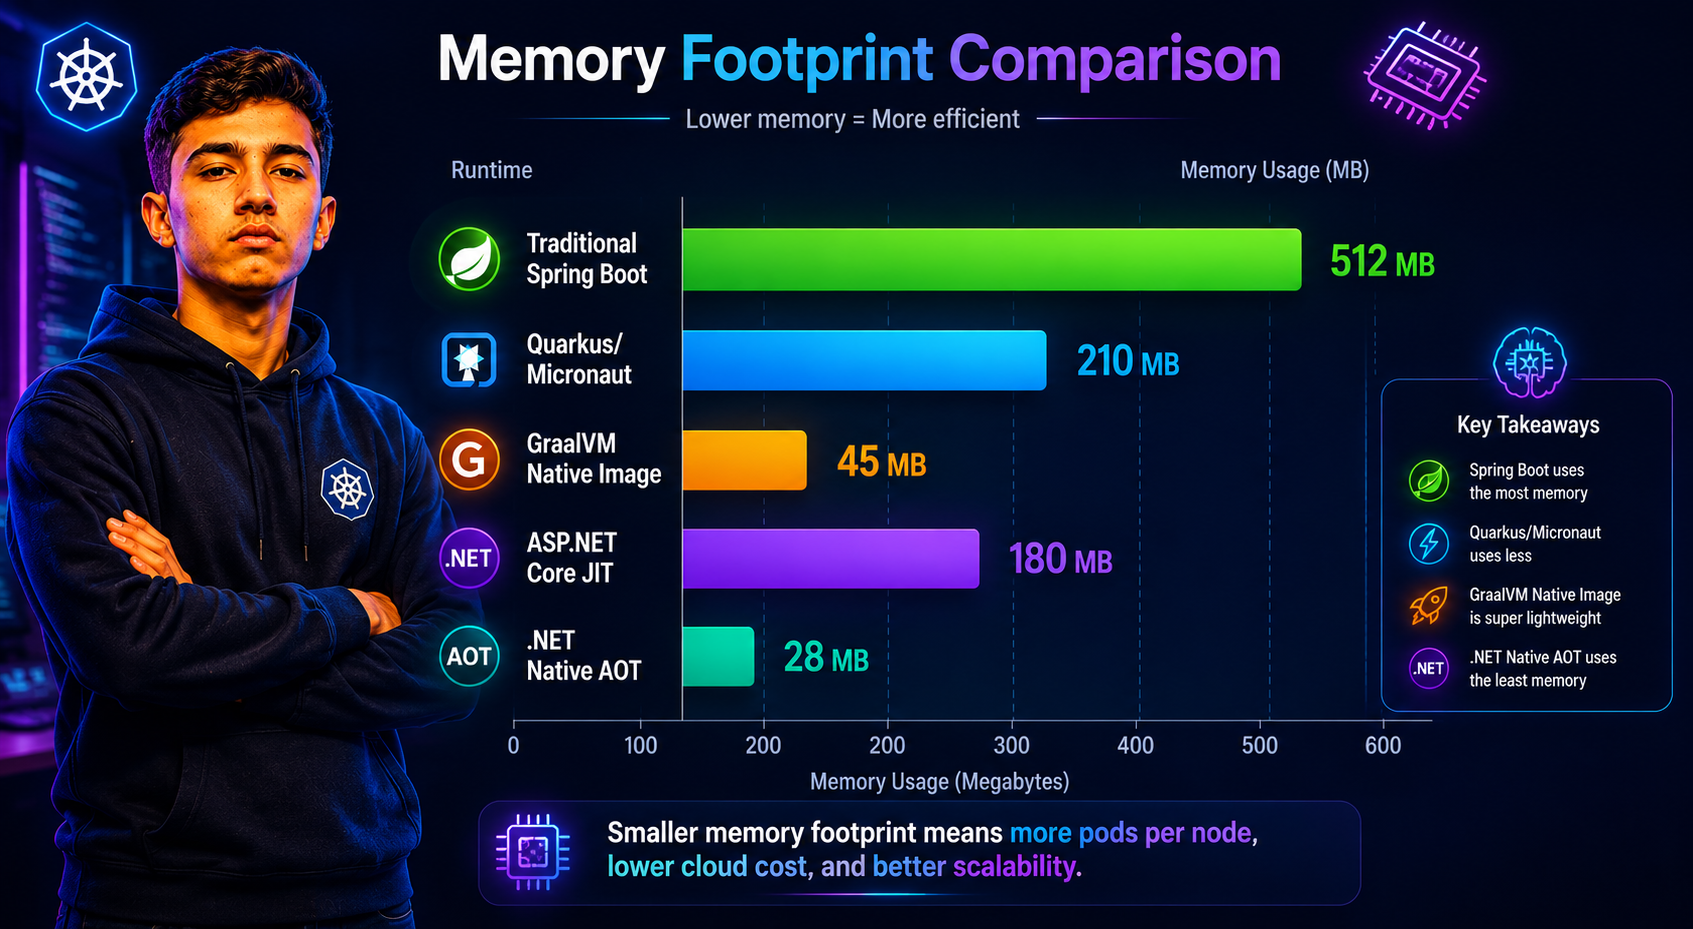
A traditional Spring Boot service sits at roughly 300–600 MB under load once you account for everything the JVM carries — metaspace, JIT code cache, thread stacks, native memory allocations. The heap is only part of that picture.
GraalVM Native Image drops this to 30–100 MB for the same service. The absence of the JVM runtime, JIT compiler, and metaspace is a dramatic reduction.
A typical ASP.NET Core service lands at 80–200 MB. The .NET runtime is lighter than the JVM baseline without any special configuration, which is why .NET has historically had lower memory consumption than equivalent Spring Boot services out of the box.
.NET Native AOT brings this down further to 20–80 MB.
At scale — 50 pods of a microservice — the difference between a 400 MB JVM pod and an 80 MB native pod is 16 GB of cluster memory across a single service. That's real money on managed Kubernetes, and it compounds across every service in a large microservices architecture.
Developer Experience and Build Complexity
Standard JVM builds with Maven or Gradle are fast, well-understood, and easy to hire for. The CI setup is straightforward, the Dockerfile is simple, and most engineers on a Java team have seen this before. That's a real advantage that's easy to underestimate when weighing ecosystem choices.
GraalVM Native Image builds are slower — 5–15 minutes for a complex service — and require dependency compatibility verification before you get a clean build. When native:compile fails due to a reflection issue, the error messages can be cryptic. The Spring Boot native hints ecosystem has improved significantly, but it's still a meaningful investment for a non-trivial service.
Standard .NET builds are fast and ergonomic. dotnet publish is polished and the tooling tends to have a shorter learning curve than Maven or Gradle for engineers coming from other backgrounds.
.NET Native AOT has similar build-time costs and constraint management overhead to GraalVM. The AOT analyzer and ILLink warnings have improved substantially in recent .NET versions, making issues easier to diagnose — though "easier to diagnose" is relative when you're hunting for a trimming-caused regression.
For teams without deep container optimization experience, .NET's standard setup tends to reach a reasonable baseline faster. For teams willing to invest the setup effort, both ecosystems' native compilation options produce broadly comparable results.
Ecosystem and Tooling
Java's ecosystem is deeper in specific domains: financial services (Spring Batch, Apache Camel), data engineering (Kafka Streams, Flink, Spark), and enterprise integration. The Kubernetes operator ecosystem has extensive Java tooling, and most major cloud provider SDKs have strong Java support.
.NET is the natural choice if you're Microsoft-stack heavy, Azure-native, or have significant existing C# codebase investments. The Azure SDK for .NET is excellent. If your team is building on SQL Server with EF Core and deploying to AKS, .NET is the path of least resistance by a wide margin.
Neither ecosystem is a wrong choice for general microservice backend work in 2026. Let your integration requirements and existing team expertise drive the decision rather than synthetic benchmark numbers.
Image Size Optimization
Java: Worst to Best
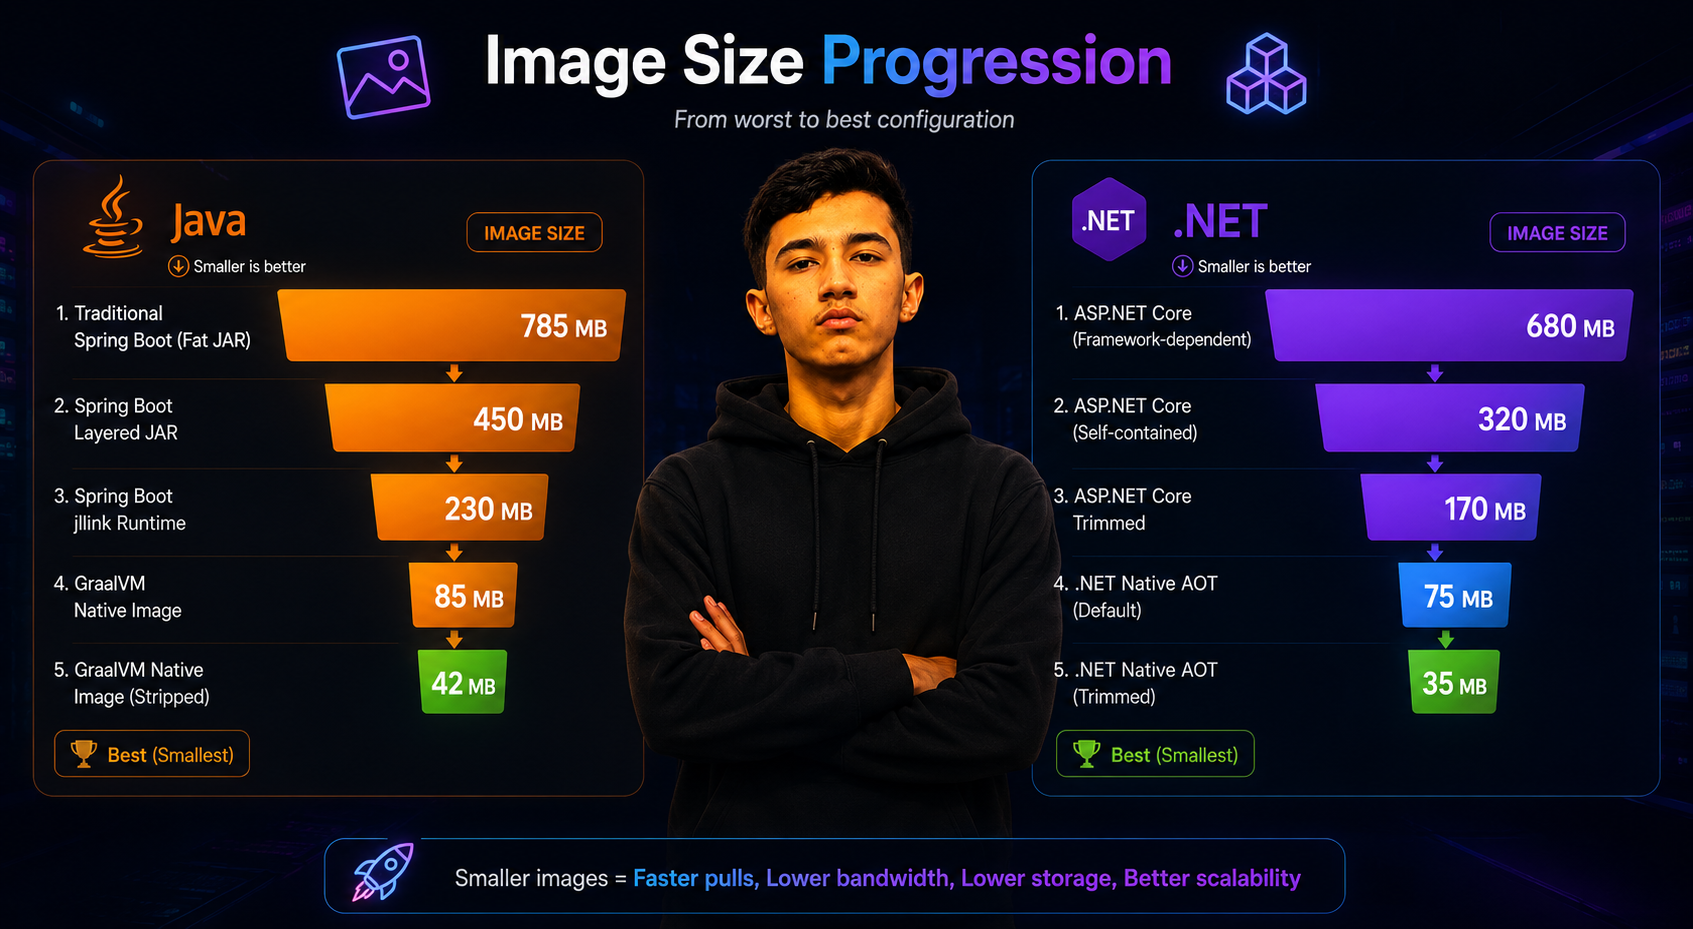
Starting from a naive full JDK with fat JAR and no multi-stage build, you're looking at roughly 600 MB. Moving to a multi-stage build with a JRE-only base gets you to 250–300 MB. Alpine-based JRE images bring this down further to 150–200 MB, and Distroless images land at around 180–220 MB depending on the runtime version.
From there, JLink is an underused option worth knowing about. It lets you build a custom JRE containing only the Java modules your application actually uses:
# Identify exactly which modules your JAR needs
jdeps --ignore-missing-deps --print-module-deps \
  --class-path "BOOT-INF/lib/*" app.jar

# Build a minimal JRE with only those modules
jlink \
  --add-modules java.base,java.logging,java.sql,java.naming \
  --strip-debug \
  --no-man-pages \
  --no-header-files \
  --compress=2 \
  --output /custom-jre
A JLink custom runtime combined with Distroless gets you to roughly 80–120 MB — meaningful size reduction without any Native Image constraints. GraalVM Native Image with Distroless represents the floor: 30–80 MB for a typical service.
.NET: Worst to Best
The naive approach — SDK image with no multi-stage build — produces a container around 800 MB. A standard aspnet multi-stage build gets you to 200–250 MB. Switching to chiseled images brings that to 100–140 MB, and adding trimming with self-contained deployment gets to 60–100 MB. Native AOT with runtime-deps chiseled is the floor: 30–70 MB.
The chiseled images are the easiest win that many teams haven't taken yet. Switching the final stage from mcr.microsoft.com/dotnet/aspnet:10.0 to mcr.microsoft.com/dotnet/aspnet:10.0-noble-chiseled is literally changing one word in your Dockerfile. Do that before anything else.
Monitoring and Observability
Both ecosystems have solid OpenTelemetry support. For Java, the OpenTelemetry Java agent provides automatic instrumentation without code changes — attach it at runtime and your traces, metrics, and logs flow to the configured exporter without touching application code:
COPY otel-javaagent.jar /otel-javaagent.jar
ENV JAVA_TOOL_OPTIONS="-javaagent:/otel-javaagent.jar"
For .NET, the OpenTelemetry.Extensions.Hosting package integrates cleanly with ASP.NET Core's IHostBuilder:
builder.Services.AddOpenTelemetry()
    .WithTracing(tracing => tracing
        .AddAspNetCoreInstrumentation()
        .AddHttpClientInstrumentation()
        .AddOtlpExporter())
    .WithMetrics(metrics => metrics
        .AddAspNetCoreInstrumentation()
        .AddRuntimeInstrumentation()
        .AddPrometheusExporter());
Micrometer (Java) and ASP.NET Core's built-in metrics APIs both produce Prometheus-compatible metrics. Standard Grafana dashboards cover JVM heap usage, GC pause times, thread pool utilization, HTTP request rates, and error rates out of the box.
One important caveat for native compilation: observability tooling that relies on JVM internals or CLR profiling APIs won't work with GraalVM Native Image or .NET Native AOT. The OpenTelemetry SDK-based approach works correctly for both compilation targets, which is a strong reason to adopt SDK-based instrumentation over agent-based approaches if you're considering native compilation. Plan your observability strategy before committing to native — not after.
Security Best Practices
Non-Root Containers
Every Dockerfile in this article explicitly drops to a non-root user. This isn't optional hygiene — it's the baseline. A surprising number of production Kubernetes deployments still run as root simply because the base image default was never overridden and nobody caught it in review.
For Java:
RUN addgroup -S appgroup && adduser -S appuser -G appgroup
USER appuser
For .NET, the chiseled images come with a non-root app user by default. USER app activates it.
Enforce this at the cluster level with a pod security context too:
securityContext:
  runAsNonRoot: true
  runAsUser: 1000
  runAsGroup: 1000
  allowPrivilegeEscalation: false
  capabilities:
    drop:
    - ALL
  seccompProfile:
    type: RuntimeDefault
Vulnerability Scanning
Include image scanning in your CI pipeline. Trivy is the standard open-source tool for this and integrates with GitHub Actions, GitLab CI, and most other platforms. The value of Distroless and chiseled images isn't purely about size — fewer OS packages means fewer CVEs to track and patch. A Distroless GraalVM native binary container and a full JDK Alpine image produce a meaningfully different CVE list when scanned. That difference grows louder every time there's a glibc or OpenSSL vulnerability.
Secrets Management
Don't bake secrets into images — not even as build arguments. In Kubernetes, use envFrom with native Secrets for low-sensitivity configuration, or the External Secrets Operator with Vault, AWS Secrets Manager, or Azure Key Vault for sensitive credentials. Both Spring Boot and ASP.NET Core read configuration cleanly from environment variables and mounted secret files without any special library dependencies.
Common Mistakes Teams Make
Java-Specific Mistakes
Setting -Xmx to a fixed value without accounting for non-heap memory. The JVM consumes memory beyond the heap — metaspace, code cache, direct buffers, thread stacks. Setting -Xmx to the container's full memory limit will trigger OOMKills even though the heap "fits." Use -XX:MaxRAMPercentage=75.0 instead and let the JVM calculate from available container memory.
Not configuring a startup probe for JVM services. Without a startup probe, the liveness probe runs immediately and restarts the pod during normal JVM warmup. This is one of the most common causes of pod restart loops on deploy that teams debug for hours before realizing what's happening.
Shipping the build stage image as the final image. An eclipse-temurin:21-jdk final image includes compilers, header files, and build tools that have no purpose in a production container.
Assuming GraalVM Native Image just works on the first attempt. A Spring Boot application with several dependencies will require reflection hints, proxy configurations, and resource includes. Budget real time for this — it isn't a one-afternoon project for a complex service.
Ignoring JIT warmup in CPU-based HPA. JVM services spike CPU on startup. If your HPA is watching CPU utilization, it will scale up pods during normal restarts, which also spike CPU, causing more scale-up. Use memory-based or request-rate-based HPA for JVM services.
.NET-Specific Mistakes
Using mcr.microsoft.com/dotnet/sdk:10.0 as the final image base. The SDK is for building. The aspnet or runtime-deps image is for running. This produces containers approaching 1 GB that are slow to pull and expose unnecessary attack surface.
Enabling PublishTrimmed=true without testing. Trimming can silently remove functionality if reflection patterns aren't annotated with [DynamicallyAccessedMembers]. Run your full integration and end-to-end test suite after enabling trimming — unit tests alone are unlikely to catch failures caused by it.
Publishing for the wrong architecture. Building on an ARM Mac and publishing for linux-arm64, then deploying to an x64 node pool, produces a container that crashes immediately on start. Be explicit about -r linux-x64 or use multi-platform builds.
Not setting ASPNETCORE_ENVIRONMENT=Production. Without it, development-mode behaviors may activate — including detailed error pages that expose stack traces to anyone who can reach the service.
Kubernetes Deployment Mistakes (Both Ecosystems)
No preStop hook and an insufficient terahJ91ZuNL8Y2px8iYciYeHN8sfSh5eXH8. When Kubernetes terminates a pod, it sends SIGTERM and simultaneously removes the pod from the load balancer. Without a preStop sleep of a few seconds, in-flight requests get dropped. Add preStop: exec: command: ["sh", "-c", "sleep 5"] and ensure terahJ91ZuNL8Y2px8iYciYeHN8sfSh5eXH8 is long enough for your service to drain — 60 seconds is a reasonable starting point.
Readiness probes that check external dependencies. If your readiness probe calls the database, a slow database will knock pods out of the load balancer rotation, increasing database pressure further. The readiness probe should answer one question: is this specific pod ready to handle requests right now? Downstream dependency health belongs in the application layer, not in Kubernetes probes.
No PodDisruptionBudget. Without a PDB, Kubernetes can evict all pods of a deployment simultaneously during node maintenance, causing complete service downtime. Set minAvailable: 1 or maxUnavailable: 1 for any service with availability requirements.
Practical Recommendations
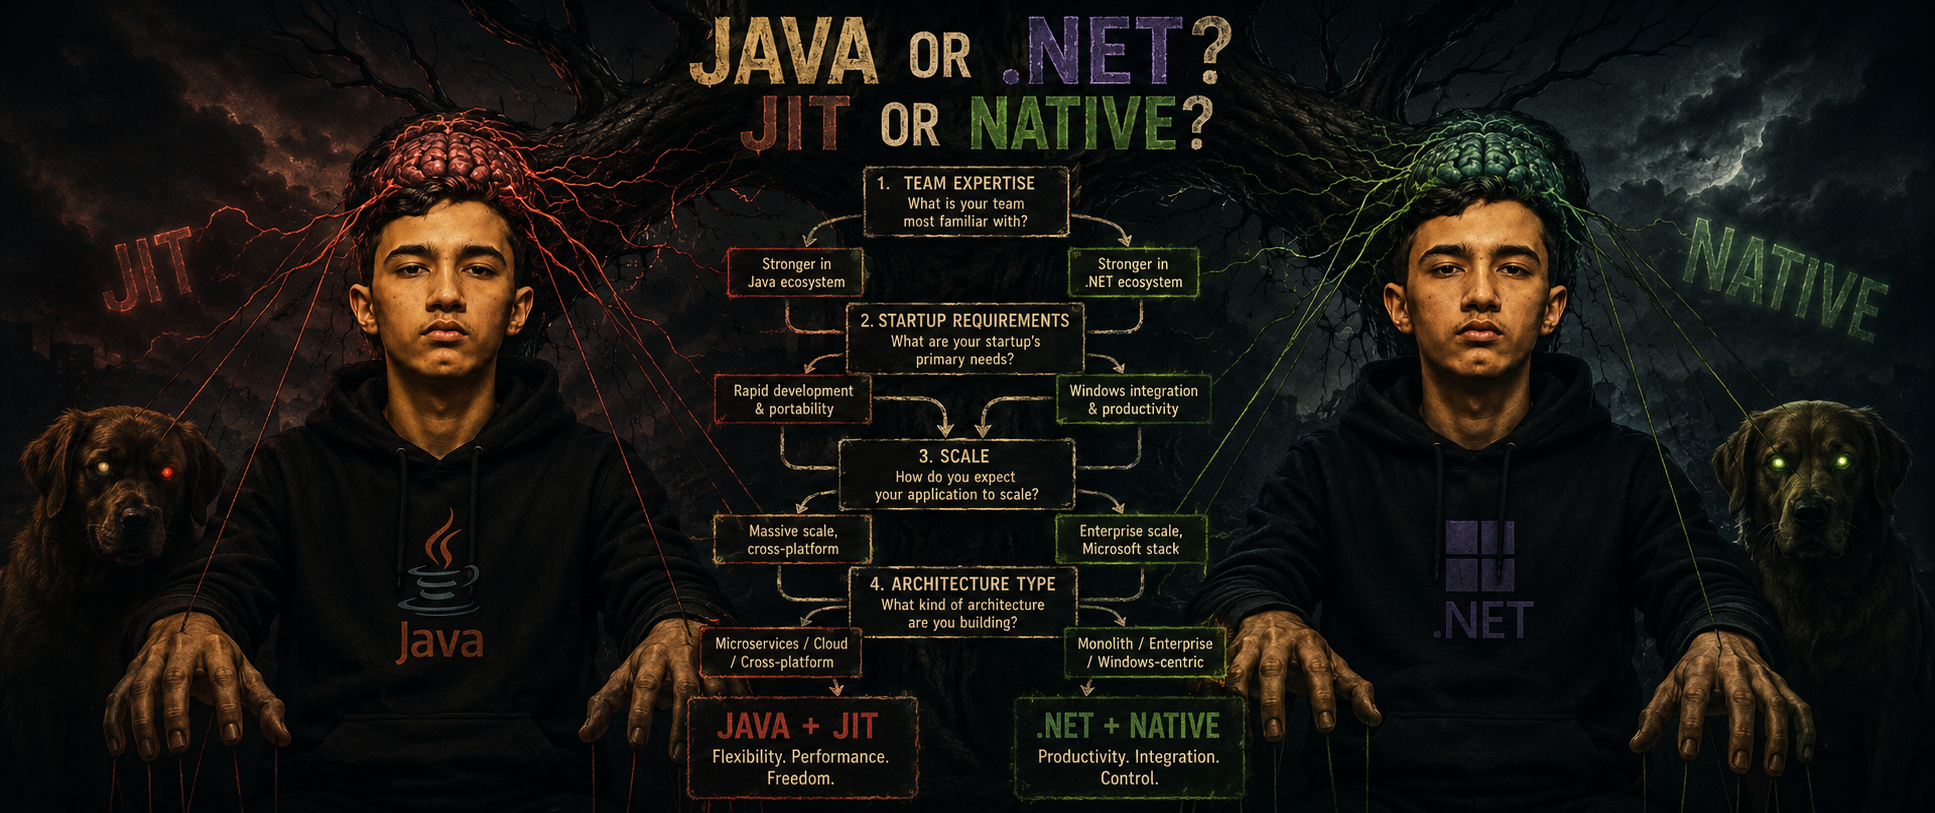
When Java Makes More Sense
You're in a Java-heavy organization with existing Spring Boot or Quarkus expertise that goes beyond surface familiarity. You're building data-intensive or integration-heavy services where the JVM ecosystem is a genuine advantage — Kafka Streams, JPA, Apache Camel, Flink. Your services are long-running with stable, predictable load patterns where JIT compilation pays off in peak throughput. You need deep integration with Java-native cloud tooling.
When .NET Makes More Sense
You're Azure-native or Microsoft-stack heavy. Your team's core expertise is C# and you want to leverage that fluency in framework APIs and ecosystem libraries. You need fast cold starts on standard JIT builds without investing in Native Image's build constraints. You're migrating Windows-origin backend code to Linux containers — the migration path is significantly smoother staying in .NET.
When Native Compilation Makes Sense for Either
Your architecture has scale-to-zero or rapid burst scaling requirements where cold start latency directly affects user experience or SLOs. Memory costs at scale are significant and you've done the math on how much native compilation saves at your pod count. Your services are stateless, structurally simple, and don't depend on reflection-heavy framework features. You have CI infrastructure that can absorb 10–15-minute native builds without blocking your team.
What to Prioritize, In Order
1. Multi-stage builds. Highest ROI, lowest effort. Every Java and .NET service should use multi-stage builds before any other optimization.
2. Resource requests and limits with correct probe configuration. An unstable deployment costs more than an unoptimized one. Get this right before worrying about image size.
3. Non-root containers and security context. Baseline professionalism, and required by most organization security policies and compliance frameworks.
4. Chiseled images (.NET) or JRE images (Java). Easy size wins with minimal effort and zero code changes.
5. Memory tuning. Once you have observability and real load data, tune based on actual heap behavior — not guesses or defaults.
6. Native compilation. Evaluate after you have real production metrics showing that startup time or memory footprint is actually a problem at your scale. Don't optimize prematurely.
Conclusion
Java and C# are both credible, production-ready choices for Kubernetes-native backend development in 2026. The gap that existed five years ago — where Java containers were notoriously heavy and slow to start — has been substantially closed through GraalVM Native Image, Spring Boot's native AOT support, and better JVM container awareness. The JVM is no longer the obvious wrong choice for cloud-native work.
.NET's traditional edge in startup time and memory footprint on standard JIT builds remains, but the difference is less dramatic than it once was. Where .NET Native AOT and GraalVM Native Image meet, the numbers are comparable.
The practical decision factors are ecosystem fit, team expertise, existing infrastructure, and specific service requirements — not abstract language benchmarks. A well-optimized Java service with proper multi-stage builds, ZGC configuration, and sensible memory settings will outperform a poorly configured .NET service, and the reverse is equally true.
What separates well-run container deployments from poorly-run ones isn't which language you chose. It's whether you're using multi-stage builds, whether your resource requests and limits reflect measured reality, whether your probes are configured correctly, and whether you have observability to catch problems before they become incidents. Get those fundamentals right first. Then optimize.
Find me across the web:
✍️ Medium: @syedahmershah
💬 DEV.to: @syedahmershah
🧠 Hashnode: @syedahmershah
💻 GitHub: @ahmershahdev
🔗 LinkedIn: Syed Ahmer Shah
🌐 Portfolio: ahmershah.dev
About the author
- I’m Syed Ahmer Shah — a full-stack developer and Software Engineering student focused on building, learning, and understanding how software comes together. I share what I learn through technical writing, development notes, and project case studies, covering code, AI, problem-solving, challenges, and the developer journey.
Comments
Join the discussionThat 11 PM Slack thread callout hit way too close to home. 😅
Seriously though, thank you for emphasizing the liveness probe vs. readiness probe distinction. I can’t tell you how many cascading failures I've seen because a liveness probe was pointing to a database health check, triggering a massive restart storm when the DB sneezed. Keeping the liveness probe strictly local to the runtime is an elite-tier tip that every K8s engineer needs to memorize.
Haha, glad (and sorry!) it hit home. The dreaded DB-dependent liveness probe is a classic rite of passage. Restart storms are brutal, and keeping that probe strictly local is the best way to keep a small sneeze from becoming a full-blown cold.
This is an incredibly thorough breakdown! The battle for memory efficiency in Kubernetes clusters is so real. I’ve seen way too many teams get bitten by Java’s MaxRAMPercentage misconfigurations leading to sudden OOMKills, so highlighting JVM heap tuning is a massive public service.
On the C# side, .NET Chiseled images combined with Native AOT really feel like a cheat code for shrinking attack surfaces and slashing startup times. In your benchmarking, did you notice a significant trade-off in compilation times when shifting heavily toward Native AOT for C#? Awesome write-up!
OOMKills from Java misconfigurations are a nightmare! Native AOT + Chiseled images really do feel like magic for .NET. As for compilation times: yes, they definitely take a hit, so it's best to save AOT for the final CI/CD staging/prod builds.
It’s fascinating to see how closely matched Java (with GraalVM/tuning) and C# have become in the cloud-native space. This post is a goldmine for anyone wrestling with polyglot microservices in K8s. Bookmarking this for my next architecture review. Thanks for putting this together!
The gap has closed so much! It's an amazing time to be building polyglot microservices. GraalVM and .NET AOT have forced both ecosystems to evolve rapidly. Thanks for reading and bookmarking, Najim!
Great breakdown of Java vs C++ in the context of Docker and Kubernetes. I really liked how you highlighted performance vs developer productivity — that’s something many teams overlook when scaling containerized applications.
One thing I’ve noticed is that while C++ can offer better performance in resource-constrained environments, Java tends to integrate more smoothly with cloud-native ecosystems and tooling, especially when working with Kubernetes orchestration.
Also, optimizing Docker images and reducing container size plays a huge role regardless of the language choice, since Kubernetes is all about efficient scaling and resource management.
I’ve been exploring similar concepts and shared some insights here: adilejasyousaf.com — would love to hear your thoughts on balancing performance vs scalability in real-world deployments.
Thanks for the thoughtful addition! You hit the nail on the head regarding Java's cloud-native ecosystem—the tooling and framework maturity (especially with things like Spring Boot or Quarkus) make Kubernetes orchestration a lot smoother for everyday development.
And completely agree on image optimization. At scale, container size dictates everything from deployment speed to cold-start times, no matter what language you're running.
I'll definitely check out your site—balancing that performance-vs-scalability tightrope is where the real engineering happens. Let's keep the conversation going!
What a battle, Both are great programming languages 🔥
Exactly! The competition is forcing both ecosystems to innovate at a crazy pace, and honestly, developers win either way. 🔥
Battle of BackFront
I’m Syed Ahmer Shah. Battle of BackFront is where I compare languages, frameworks, libraries, and tools through a practical engineering lens. I focus on real trade-offs—performance, maintainability, scalability, developer experience, and where each choice actually makes sense. Part of Syed Ahmer Shah | Engineering Logs: Design, Sync, Energize.